Description
What This Tool Does
The Statistical Significance Analysis Tool & Report Generator is a fully formula-driven Microsoft Excel template built to answer one question with statistical rigor: did your program actually work? It uses a matched pairs t-test — the industry-standard approach for pre/post study designs — to evaluate whether the change observed in your population is statistically meaningful or simply the result of random variation.
You enter your data. The tool does the rest. A professionally formatted report is generated automatically, complete with hypothesis statements, an outcome verdict, key statistics, a population distribution chart, and a pre/post comparison chart.
Three Program Objectives
Select the objective that matches your program and the tool applies the statistically correct test automatically:
- Increase — one-tailed test evaluating whether the measured variable rose by a statistically significant amount
- Decrease — one-tailed test evaluating whether the measured variable fell by a statistically significant amount
- Maintain — two-tailed test evaluating whether the measured variable held stable without significant movement in either direction
Who Should Use This
- Healthcare & Clinical — patient outcome programs, biometric interventions, treatment protocols, rehabilitation studies
- Education & Training — curriculum effectiveness, learning gain measurement, corporate training assessment
- Business & Operations — Lean/Six Sigma process changes, HR program evaluation, sales initiative impact
- Research & Academia — pre/post experimental and quasi-experimental studies requiring reproducible statistical output
- Nonprofits & Government — program effectiveness evidence for funders, grant reporting, regulatory submissions
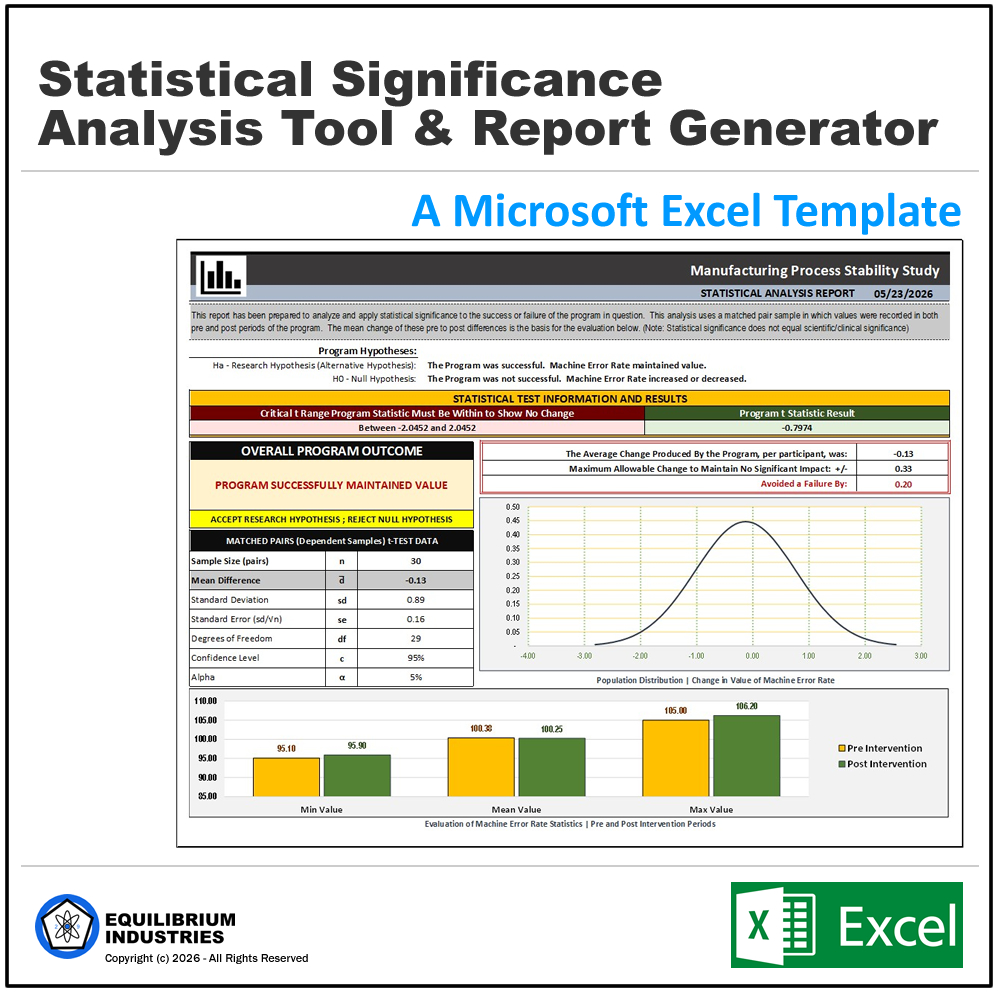
What the Report Includes
- Research and Null hypothesis statements, auto-generated from your inputs
- Critical t Value and Program t Statistic side-by-side decision framework
- Plain-language outcome verdict and Accept/Reject determination
- Average change per participant, minimum change needed to pass, and beat/fell-short margin
- Full matched pairs t-test statistics: n, d̅, sd, se, df, confidence level, and alpha
- Population distribution bell curve chart
- Pre/Post intervention comparison bar chart (minimum, mean, and maximum values)
Technical Specifications
- Platform: Microsoft Excel 2016 or later (Windows or Mac)
- No macros, no add-ins, no external dependencies
- Accepts 25 to 250,000 observations per analysis
- Confidence levels: 80%, 85%, 90%, 95%, 99%
- Pre and Post values support up to two decimal places
- Built-in data validation: integer enforcement, dropdown-restricted inputs, row count matching
- Delivered as an Excel Template file (.xltx) for unlimited reuse
What Is Included
- Statistical Significance Tool — Excel Template (.xltx)
- Product Installation Guide & Reference Manual (PDF) — available on the product page
- Video walkthrough — available on the product page
- For questions or to discuss specific needs that may warrant customization of this template , please email: stat.tool@equilibrium-industries.com
LICENSE & USAGE TERMSSingle-User License. This product is licensed for use by a single individual or a single organization for internal use only. Purchase of this template does not transfer ownership of the underlying intellectual property.No Redistribution. This file may not be copied, shared, resold, sub-licensed, distributed, or otherwise transferred to any third party — in whole or in part — in its original form or any modified form. Providing access to this file to individuals outside your organization is expressly prohibited.No Derivative Works for Distribution. You may modify this template for your own internal use. You may not distribute, sell, or sub-license any modified version of this file.Reports Are Unrestricted. Statistical reports and outputs produced using this tool may be shared freely. Only the template file itself is subject to these restrictions.By downloading this product you agree to these terms. Violations may result in license termination and legal action under applicable intellectual property law. © 2026 Equilibrium Industries, LLC. All rights reserved. |
Reviews
There are no reviews yet.